
Data Analytics in Modern Corporate Business
Become a data-driven professional and master modern analytics in a corporate setting.
📌 About the Course
Data Analytics in Modern Corporate Business is a comprehensive course designed to equip participants with the essential skills and knowledge needed to harness the power of data analytics within a modern corporate setting.
💬 Testimonials
🧑🎓 Loukas Apostolidis
"”What I wanted from the course and it delivered was to understand the data flow, even if it’s not your job to build data pipelines.”

🧑🎓 Spyridon Armeniakos
"”I had never seen a complete pipeline before; I really liked that part, especially the one with BigQuery”

👤 Audience
This course is ideal for:
- Participants looking to enter the modern field of data analytics,
- Business professionals seeking to strengthen their data skills or transition into their first data analytics role,
- Ambitious data analysts eager to enhance their analytical abilities and apply them in a corporate environment.
The program covers five thematic modules in modern data analytics:
- Introduction to Data Analytics and Roles within Various Teams
- Databases and SQL
- Git
- Data Warehousing
- Data Visualization
This course is structured according to the standards of modern European academic programs and is designed to align with the European Credit Transfer and Accumulation System (ECTS) framework. By completing the course and the capstone project, you will have fulfilled the learning outcomes and workload equivalent to 3.5 ECTS credits, which is a recognized measure across universities and professional education providers in Europe.
➡️ Entry Requirements
- Basic familiarity with computer use (no certification required)
- Holders of a higher education degree
- High school graduates (e.g., current students)
ℹ️ Program Details
- Scientific director: Dimitrios Varsamis (Field of Expertise: Applied Mathematics)
- Academic director: Dimitrios Varsamis
- Basic subject:Economics and Management Sciences
- Subject subcategories: Mathematics & Statistics, Information Technology & Telecommunications
🎯 Educational Objectives
By the end of the course, participants will be able to:
- Understand and implement both data analytics fundamentalsand advanced data analytics concepts:
- Grasp the core principles of data analytics, including data collection, processing, and analysis techniques.
- Use advanced techniques in data manipulation and visualization.
- Utilize Industry-Leading Analytical Tools:
- Proficiently use SQL for database management and querying.
- Employ Python for data manipulation, ETL processes, and automation.
- Leverage BigQuery for large-scale data storage and advanced analytics.
- Create interactive and insightful visualizations using Tableau Cloud and Metabase.
- Design and Execute Data Analytics Projects:
- Develop end-to-end data analytics pipelines from data ingestion to visualization.
- Implement real-time data replication and synchronization using Google Datastream.
- Optimize data workflows for efficiency and performance.
- Communicate Insights Effectively:
- Develop compelling data visualizations and dashboards that convey actionable insights.
- Use data storytelling techniques to communicate findings to stakeholders clearly and persuasively.
- Collaborate Using Version Control:
- Manage project codebases effectively using Git.
- Collaborate with team members through branching, merging, and pull requests.
By achieving these outcomes, participants will be equipped with the skills and knowledge needed to leverage data analytics to enhance business performance, drive strategic decisions, and create competitive advantages in the corporate world.
📚 What You Will Learn
- 📊 Understand core principles of data analytics
- 🧠 Leverage data for strategic decision-making
- 🔍 Analyze and visualize data using Tableau & Metabase
- 🔄 Implement end-to-end data analytics pipelines
- ⚙️ Automate workflows with Python
- 🗃️ Store and query data in BigQuery
- 🔁 Set up real-time replication with Google Datastream
- 💻 Collaborate through Git version control
🛠️ Tools & Technologies
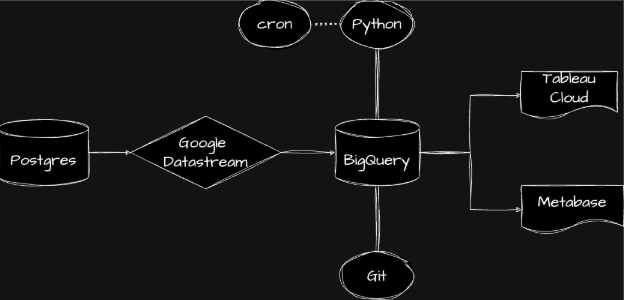
🧪 Capstone Project (Real-world challenge simulation)
Design a pipeline that ingests transactional data from PostgreSQL to BigQuery, transforms it with Python, tracks development in Git and builds visualizations in Tableau and Metabase.
Deliverables:
- ✅ BigQuery staging and reporting tables
- ✅ ETL Python notebooks in GitHub
- ✅ Tableau & Metabase dashboards
🏆 Certification & Grading
| Component | Weight |
|---|---|
| Assignments | 20% |
| Capstone Project | 80% |
🧮 Must score 75/100 or more to get certified.
Track progress through module-wise assignments and complete a comprehensive capstone for final evaluation.
Example Grade Calculation Assignment scores:
- 65/100
- 70/100
- 90/100
- 100/100
- 76/100
The total assignment score is 401 out of 500, averaging 80.2 out of 100. For final grade calculation: 80.2 (assignment average) * 0.2 (20%) = 16.04
Thus, to achieve the required final score of 75, the candidate needs at least: 75 (required final score) - 16.04 (assignment contribution) = 58.96 on the capstone project.
🎙️ Podcast: Coming Soon
Stay tuned for our upcoming podcast episode featuring alumni discussing the value of of the course in today’s businesses.
🚀 Ready to Enroll?
If you’re ready to master data analytics and boost your career — this is your next step.