Run python scripts and use output tables with Tableau Table Extension
Why
Suppose working in a Tableau workbook and need to make some operations that either are impossible with Tableau or a bit hard. You realise that it would be achieved more easily, in a straightforward and readable way by using some Python code. Another case could be to make some predictions inside the workbook by running a simple scikit-learn model. You want the model to run everytime the data is refreshed. Available in Tableau 2022.3, Table Extensions allow you to create new data tables with an analytics extensions script. We can write a custom Python script using TabPy and optionally add one or more input tables. Using Table Extensions, you can unlock new data and transform, augment, score, or otherwise modify our data using Analytics Extensions like Python, R, and Einstein Discovery.
Note: Table extensions differs from writing code directly as Tableau calculated fields. It unlocks the capability to use a table in the tableau data model as output after some Python processing.
Setup & Configuration
Let’s start cooking 🧑🍳.
Python
First, download Python from here.
Tableau Desktop
Next, download Tableau Desktop(>= 2022.3 version). We’ll NOT use Tableau Server for this example.
Tabpy
TabPy(the Tableau Python Server) is an Analytics Extension implementation that expands Tableau’s capabilities by allowing users to execute Python scripts and use the output either in a calculated field or as table extension.
To install TabPy using pip, run:
pip install tabpy
and to start the server run:
tabpy
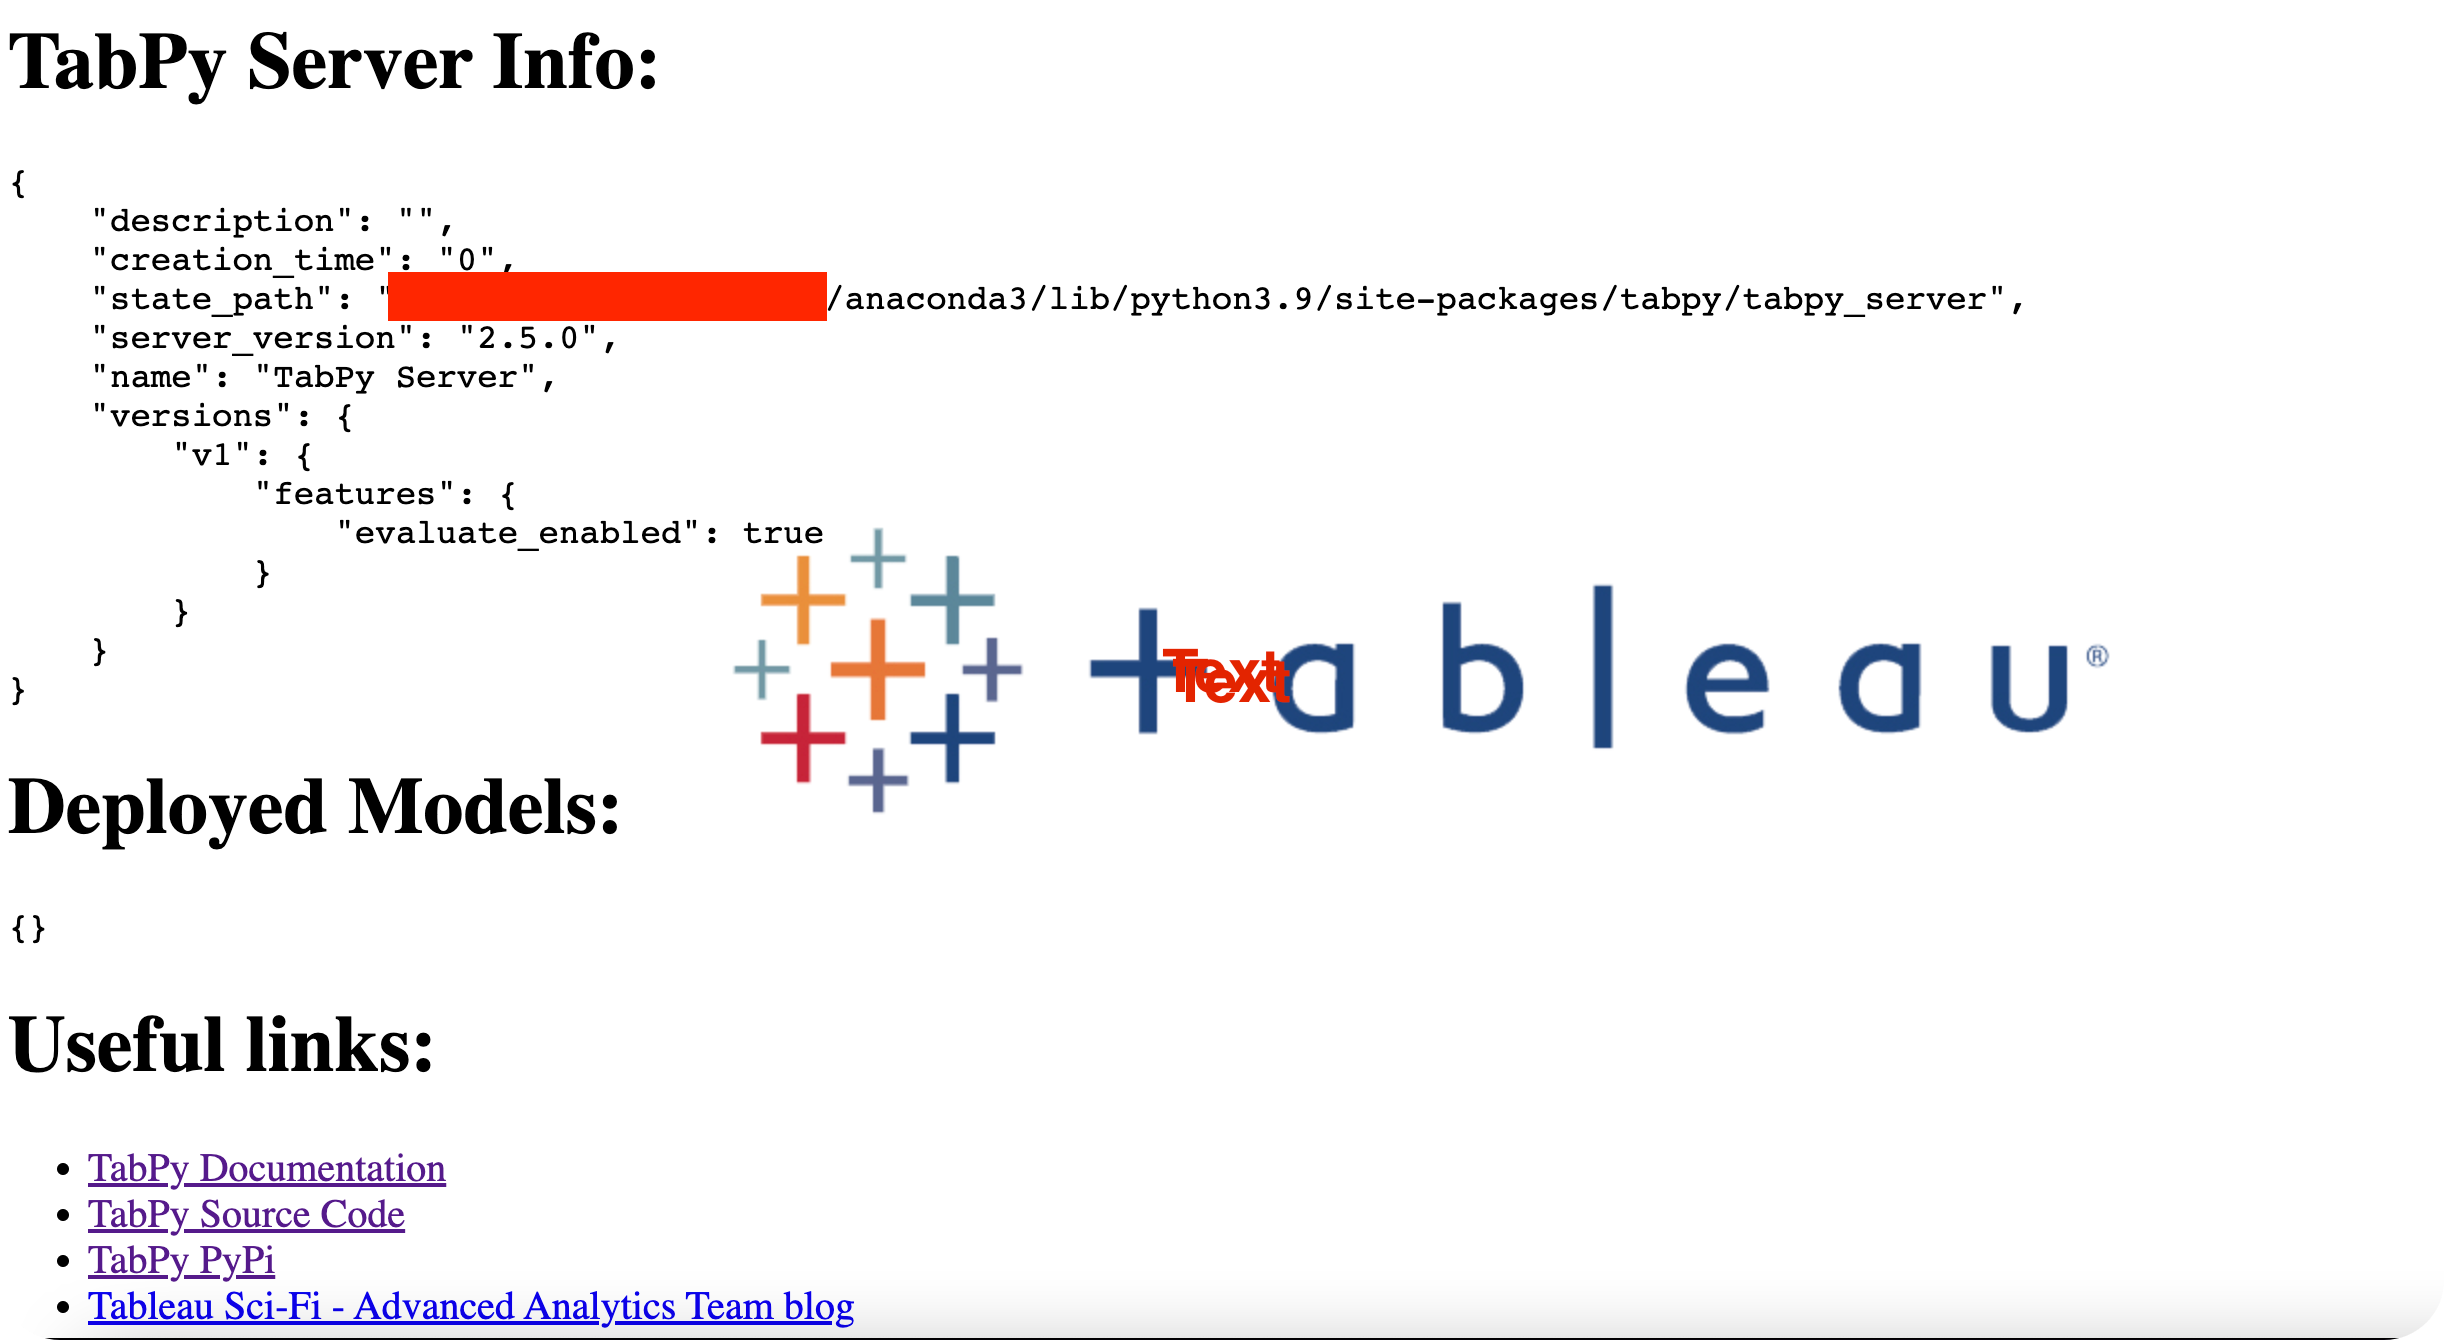
The desired output is something like this:

By navigating to localhost:9004 ensure that the server is running successfully.
We are now ready to taste our food 🥄.
The Actual Thing
We’ll use the Sample - Superstore dataset to build 5 clusters with Quantity,Discount,Profit variables.
Connection
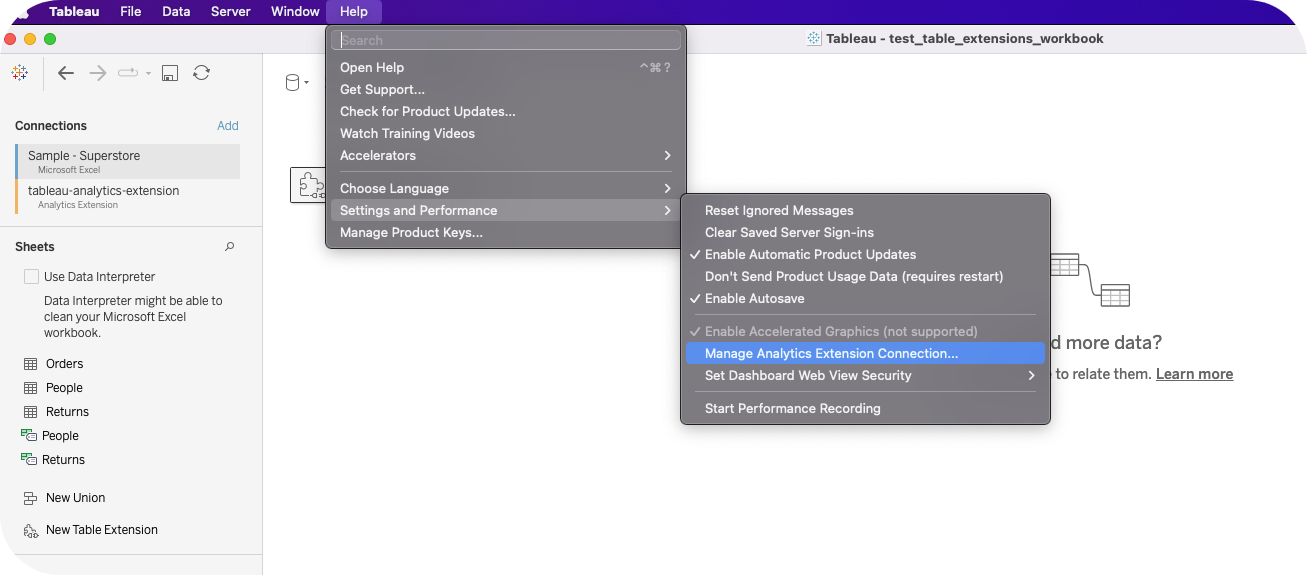
By navigating to Settings and Performance and selecting Manage Analytics Extension Connection connect with the python server.
Data pane
We can now select any of the existing tables from our connections and notice that when a table is dragged into the pane the input table and output table selections appear in the bottom.We also can insert our script.
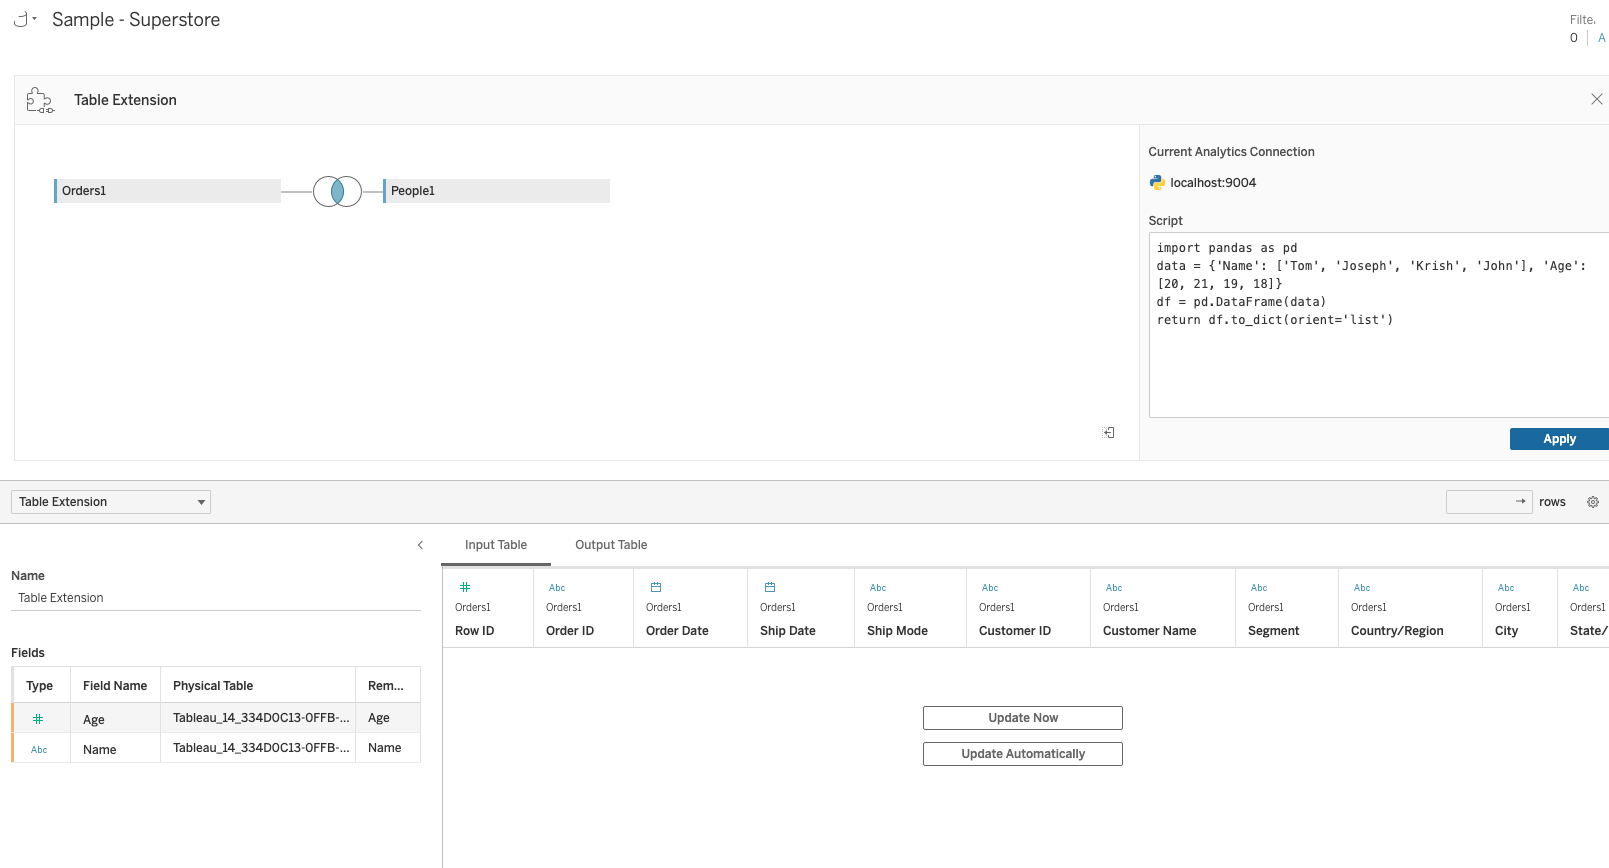
Note: The image used above contains code and schema from another example.
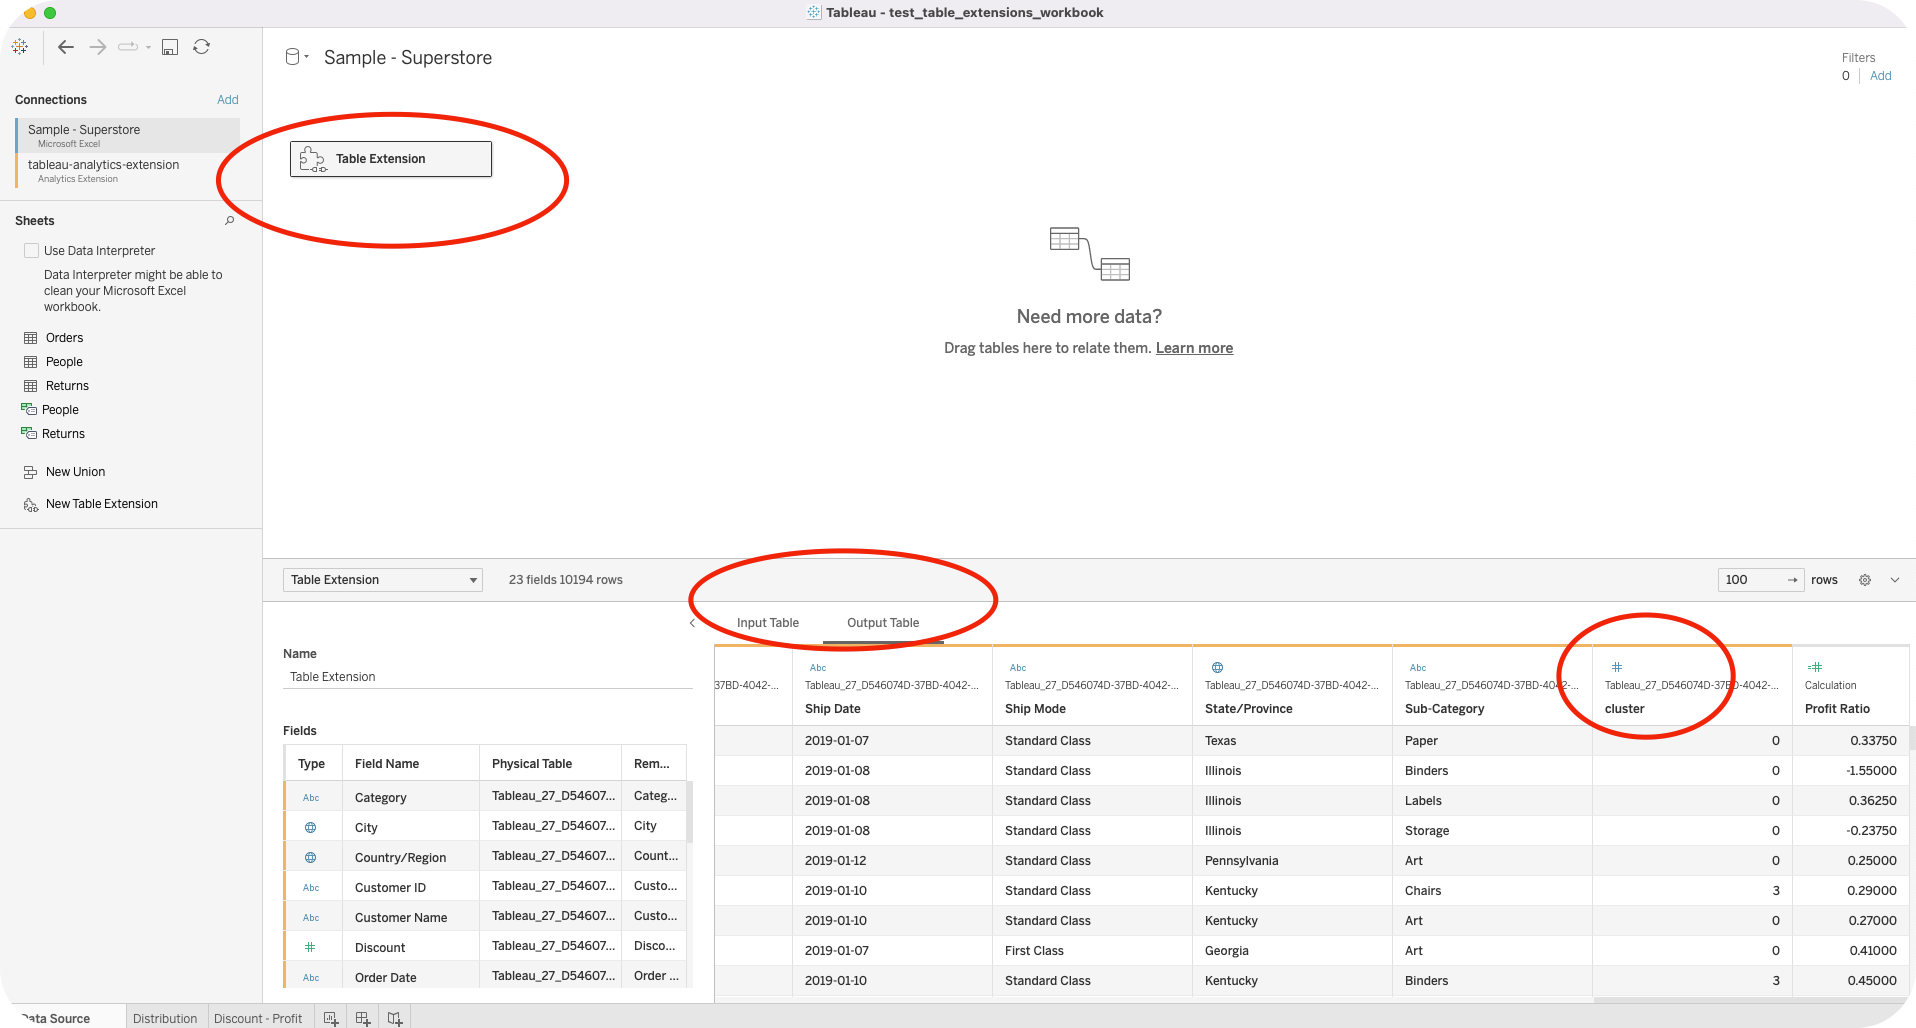
Our output table is shown as Table extension.In Script, enter your script, select Apply and choose Update. Now and the results will appear in the Output Table tab.
When the code runs, the output table will include any new columns from the returned python dictonary. The new column cluster has been created.
Code
The script contains the code below.
import libraries
import pandas as pd
import numpy as np
from sklearn.preprocessing import StandardScaler, MinMaxScaler
from sklearn.cluster import KMeans
#Convert tableau imported table to pandas df
arg1 = pd.DataFrame.from_dict(_arg1)
#Fit K-Means
kmeans = KMeans(n_clusters=5,  random_state=0).fit(
    arg1[['Quantity','Discount','Profit']])
#Get cluster assignment labels
labels = kmeans.labels_
#Format results as a DataFrame
results = pd.DataFrame([labels]).T
#Rename column
results.rename(columns={0: 'cluster', }, inplace=True)
#Join to main dataframe
orders_clusters = pd.concat(
    [arg1, results], axis=1)
#Return table as dictionary
return orders_clusters.to_dict(orient='list')
Clusters
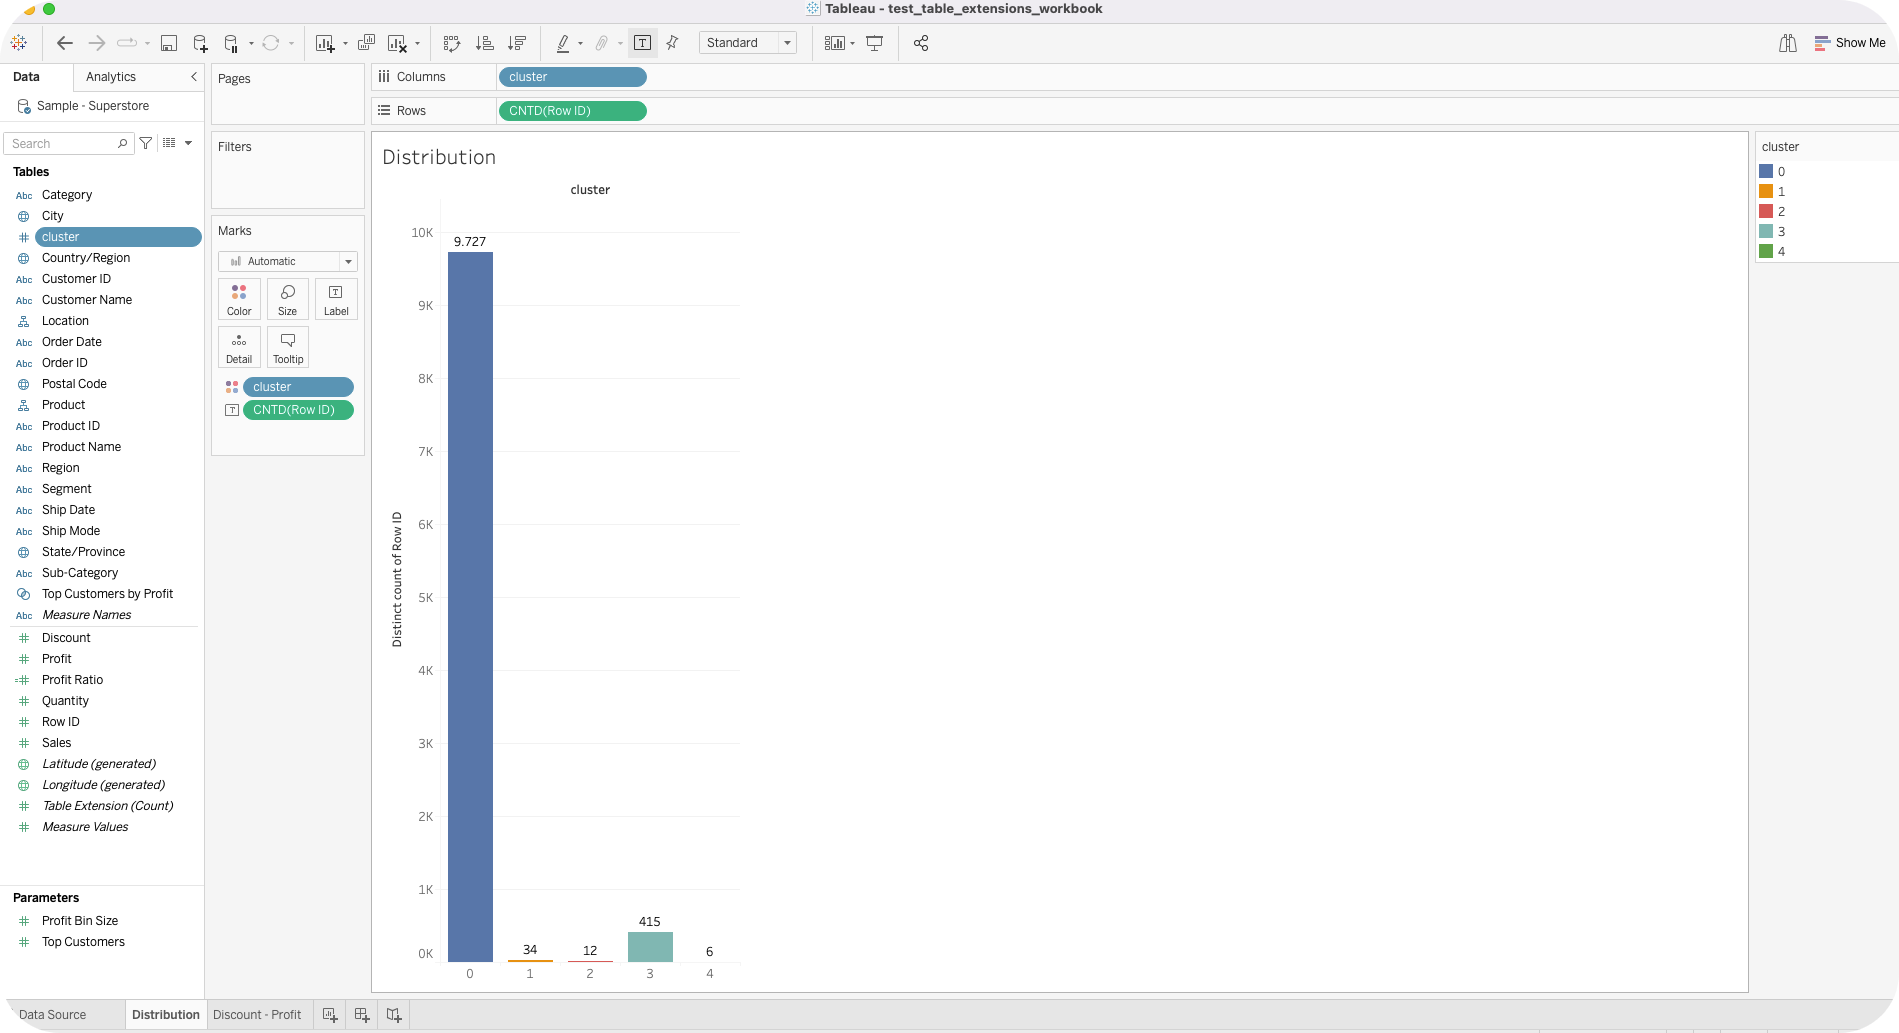
We can now visualize our clusters. In the Distribution worksheet, we can say hello.
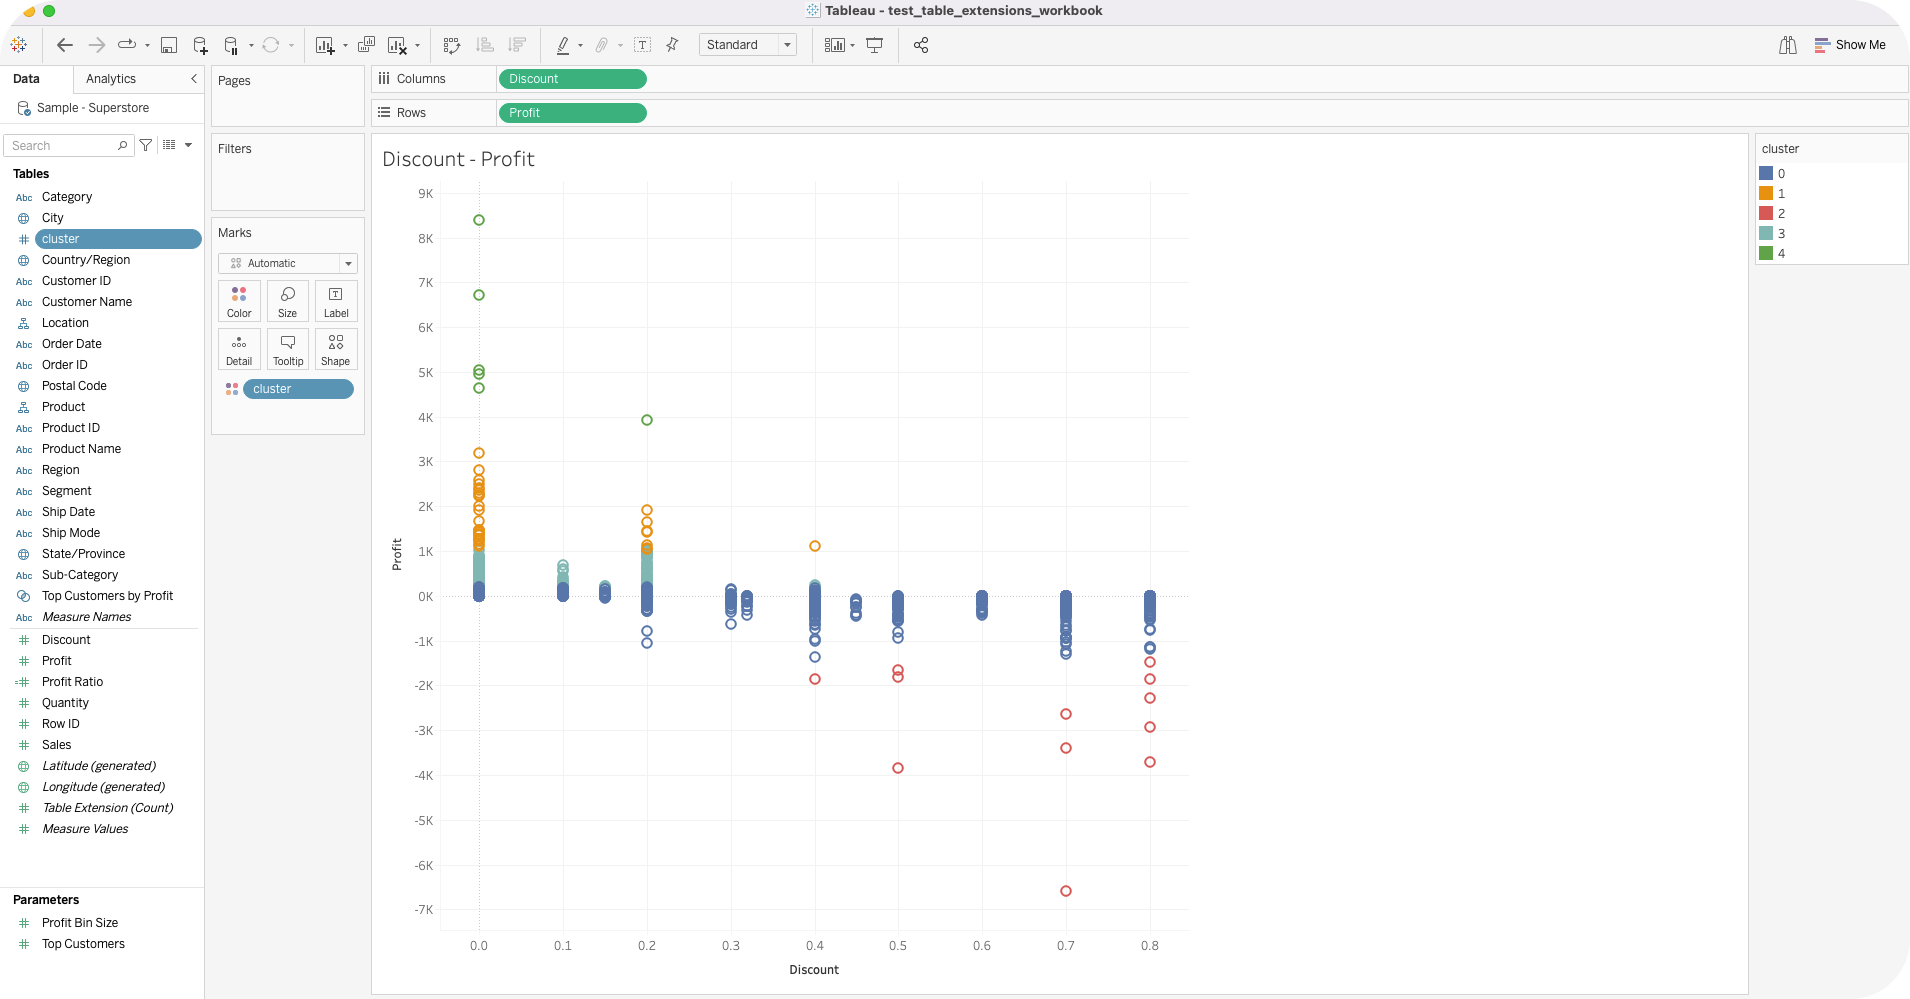
 The Discount Profit scatterplot displays the correlation between 2 out of the 3 independent variables highlighting the colour of each cluster.
Summary
In a nutshell…We’ve managed to run python in Tableau Desktop locally and started a TabPy server. We can store data as dataframes from any database. Depending on our desired outcome, we may use tables from existing connections (or not), manipulate this data based on our needs and finally blend with the tables placed in our Tableau Data model. The python script should return a dictionary which will be used as the extended table.
References
- https://help.tableau.com/current/prep/en-us/prep_scripts_TabPy.htm
- https://towardsdatascience.com/tabpy-combining-python-and-tableau-511b10da8175
- https://www.tableau.com/blog/release-data-guide-table-extensions-dynamic-zone-visibility
- https://help.tableau.com/current/pro/desktop/en-us/td_table_extensions.htm
Did you like the post? Empower me to dedicate more time and resources to curate, create, and share content that educates and inspires.

